
Science and Technics
SkyView, a weather viewer from DWD, was many years ago an exciting application to display weather content as layers over maps. In a time when only specialized geoengineers talked about GIS, meteorologists had been forced to display weather content on maps for a long time. And with the then ultramodern Flash from Adobe it was possible to draw vector data quickly and with high performance – including map and weather data.
SkyView was launched in 2000 with the data of the local model LM with 7 km grid point width. This model showed only predictions for Germany and these predictions lasted 48 hours. A fundamental improvement was implemented in 2006: by using the LME (Lokalmodell-Europa) the forecast range was extended to Central Europe. The LME was replaced in its further development by the ICON-EU, which is still the basis of the data for Skyview today.
The operation of SkyView can be called old-fashioned. But after all, in the past and even today, it was possible to superimpose up to four layers of useful information:
Transparent layers had never been used in Skyview, whose current software version dates from 12.01.2015. Therefore the colored area information like coverage, precipitation or the ground gust areas always covered the topography. Since the ICON-EU, the forecast has covered 3 ¼ days and GAFOR still only 6 hours.
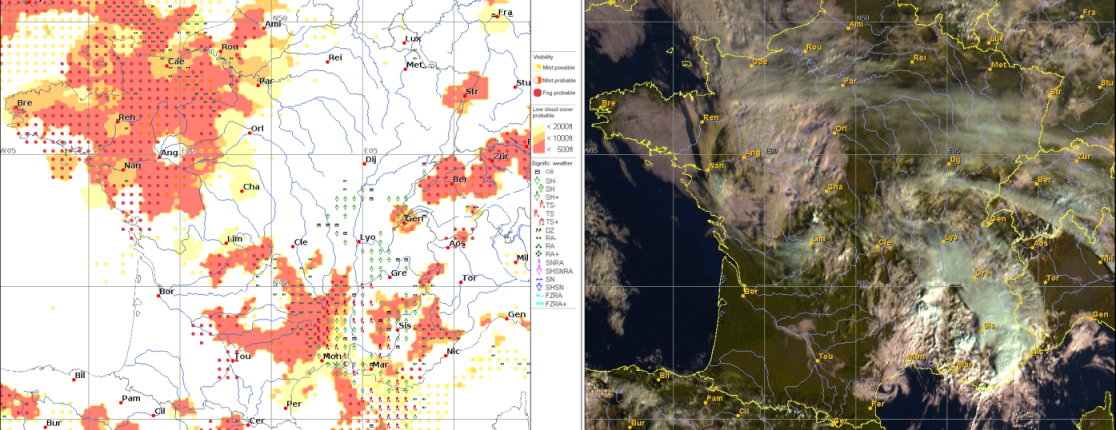
SkyView was only overview of the weather as the model sees it – raw parameters. Safety-relevant meteorological parameters for aviation, such as visibility and cloud base, had never been taken into account. So the flight planning was rather based on trust à la: “if no low clouds were predicted, I can fly”. If, however, a high degree of cloud cover was visible in the prediction parameter “low clouds”, one had to improvise or hope. Something you also experience when using many other planning tools, such as Windy. The predictions of TopMeteo offer here for up to 6 days in advance an hourly forecast of cloud base and visibility.
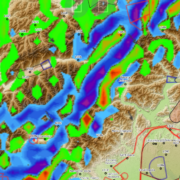
For glider pilots convection was the main prediction parameter. However, a small interpretation hurdle was built in: cumulus with a high cloud base were often marked as Ac/Cc (altocumulus, cirrocumulus). This hurdle is not built in at TopMeteo. Soarable thermals are analyzed as soarable thermals.
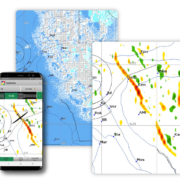
At TopMeteo we draw special maps for aviators – with all relevant information in the map. We rely on fast map navigation in always the same map sections. This ensures quick spatial orientation; because who wants to look for Denmark and Italy again and again for orientation when a new map is loaded?
For more than 15 years we have remained true to our goal of offering pilots the advantage of a minimum of time for a maximum of safe meteorological flight planning.
You are using SkyView and would like to continue using something similar in 2021, then try TopMeteo for 14 days without obligation and free of charge:
TopMeteo – where the meteorologists fly themselves
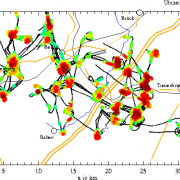
From my diploma thesis (1996)
In my diploma thesis I examined the logger data of the German Championship in Lüsse. At that time, loggers were still brand new and had just supplanted the barographer and the camera.