The structure of the thermals
From my diploma thesis (1996)
In my diploma thesis I examined the logger data of the German Championship in Lüsse. At that time, loggers were still brand new and had just supplanted the barograph and the camera.
In this contest old formal school of optical turning was in contrast to the new data driven turning with loggers. Being cautios the contest organizers ment to “quasi optical turn” with the new loggers. This was a reason of never ending discussions, as on one day in standard class the turn-point-coordinates laid 4 km away from the (former optical) turning point.
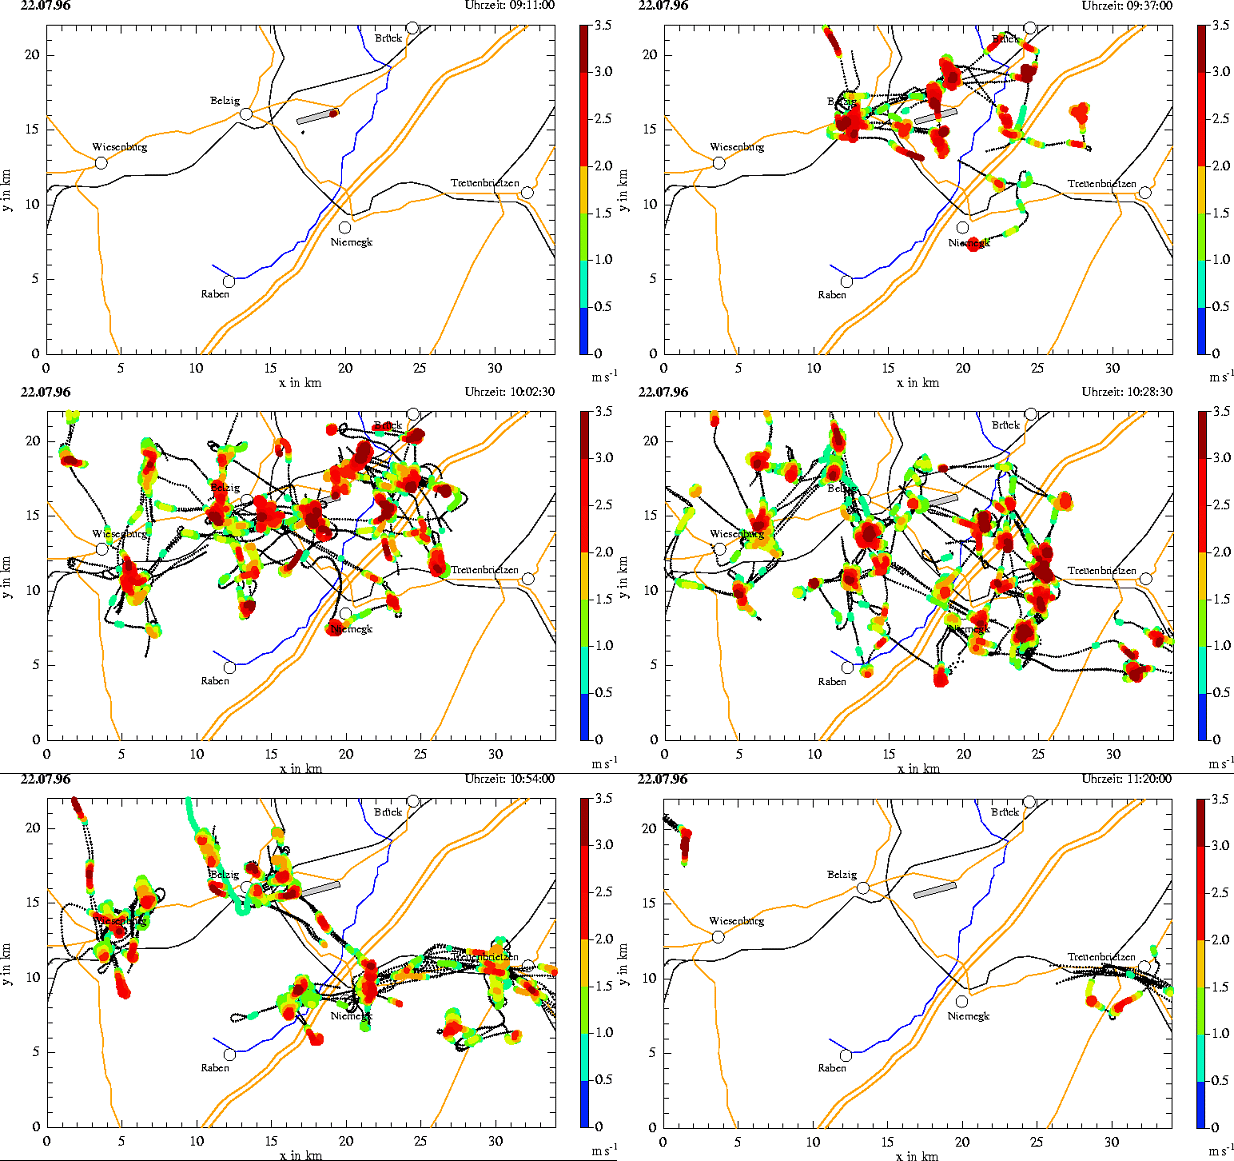
At the time of the animation, I wrote: “The animation gives a glance of the area around the airfield at 10:10 UTC on July 22, 1996. It shows the measurement points of all aircraft recorded in the previous 10 minutes. The vertical speed is filtered at 0.017 Hz so that the average vertical rise of a glider over 60 seconds is represented and dynamic flight effects fall out. The strength of the vertical movements can be estimated via the color scale of the points. High vertical velocities are drawn on top of the bullets, so that the information about the strength of the thermals is not lost. In addition, the small black dots reflect those measurements where no updrafts were found or used. The starting gates to be used that day were Belzig, Wiesenburg, and Treuenbrietzen, which explains the concentration of gliders and thermals around these locations.”
The aim of the diploma thesis was to investigate the spatial temporal structure of the thermals from the brand new IGC logger data.
The animation shows very nicely how the thermals pulsate and the pilots have to shift the positions again and again to get into the optimal position for the opening of the gate. The animation cannot provide a comprehensive overview of the thermals, since not every upwind was approached by the pilots of the German Championship.


