
Continuation and Update – Successful Usage of our own Forecasts!
In an earlier article we had Bernd Goretzki tell us how he approaches the planning of the 1,000 km and 1,000 point flights. Now there was a seventh flight, which we describe and below follows the continuation of the interview!
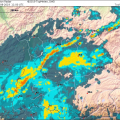
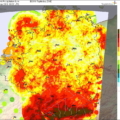
On 14.08.2019 there was another flight of Bernd over 1.100 points. The day started quite weakly, which was due to the cold front moving away to the east. With such postfrontal situations the PFD doesn’t look so perfect for a big flight either (Bernd talks about the exact planning of such flights below). Thermals are still damped below the cloudy areas right behind the front. In the morning flying against the wind with still weak thermals and a low cloud base was again his tactic. The early effort was rewarded with a tailwind leg over 400km and a 140 km/h cut far into Poland. Planning this is possible for every pilot thanks to the tailwind PFD, which is marked on the maps as a coloured arrow.
In an earlier article we let Bernd Goretzki talk about how he approaches the planning of the 1,000 km and 1,000 point flights. The interview continues here!
How does it work in the evening to close the flights at the departure point?
During this year’s flights I often noticed that it was stuck in the evening. The Fleming was not so homogeneously developed and I often had to be patient.
The flights on 05. and 07. May are almost identical. The one from 07.05.2019 we have already described here. What is there to say about the other days?
The flight at July, 3rd was to the south of Locktow. Unfortunately the “Erzgebirge”, the mountains at the Czech border, disappointed me. They do so with great regularity. And I consider the Zittau mountains to be the Bermuda triangle of German gliding: the passes to the Czech Republic always bring a lot of wind with them and disturb the thermals. Air masses and conditions are rarely homogeneous in this area.
The flight at May, 14th was an escape from the incoming bad weather. Early in the morning I had to flee from the overcast to the southwest, into the actually not so good area east of the “Harz” mountains. On the longitude of Kassel I went north into good soaring conditions and turned near the Baltic Sea. Then, in the late afternoon, I was able to close the flight and extend the flown distance. Late, the overcast conditions vanished and the weather in the “Fläming” developed again.
 - 14.08.2019-2019-08-15 09_37_03")


When you talk about spread outs and overcast, how do you know they’ll be gone by the end of the day?
The forecasts we are making are already meeting the requirements for predicting spread outs quite well. Especially in the cloud distribution they are easy to see. But the most important thing is that I can keep up to date with the latest developments on the road with our TopMetSat app.
How do you plan your big flights with TopMeteo forecasts?
I do not plan such a flight with the PFD chart alone. With the PFD I plan the day, thus whether I should fly or not. Especially for blue thermals and spread outs the cloud distribution in hourly intervals is the most important map. Here I can see whether at all the cumulus situation is suitable for a cross-country flight. I can do this detailedly for the individual hourly segments of my planned flight. Eventually I look into the “thermals” map to estimate when convection will start in the morning and how high the working heights will be. The PFD can sometimes be a little misleading. So I also lay routes through areas, which are colored blue in the PFD on not too long distances, if the cloud distribution shows sufficiently good development during my planned transit time. Also, the wind arrows in the PFD chart are important if they show up, because they show the speed axes.
So thank you Bernd for sharing your knowledge!